An educational Java debugger plugin for Eclipse.
This video shows how the execution of the Insertion Sort algorithm is illustrated in PandionJ. All the illustrations are based on source code analysis. The user just runs the code in debug without having to provide any additional information.
PandionJ is free and built on Eclipse, below you can find Eclipse distributions with PandionJ pre-installed.
* Recent versions of Mac OS disallow downloads from a non-identified developer site, which is our case.
Solution: Run the following command in the terminal (on your installation dir)
xattr -d com.apple.quarantine Eclipse.app
As an alternative, you can install PandionJ from the update site. If you downloaded a pre-installed package (links above) you don't need to do this.
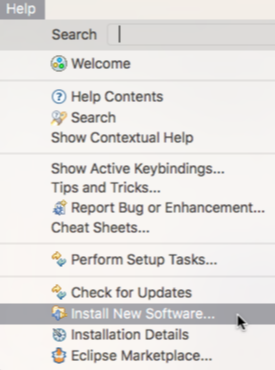
We recommend the package Eclipse IDE for Java Developers, which requires Java 17 or greater. PandionJ may not work properly in different packages or more recent versions of Eclipse. After downloading, open Eclipse and select "Install New Software..." in the Help menu. Future updates may be obtained by selecting the "Check for Updates" item available also in the Help menu.
Insert the following URL into the "Work with" textbox: https://pandionj.iscte-iul.pt
Tick all the options, and proceed with the installation.
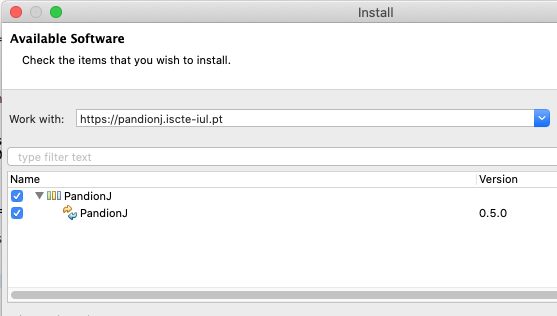
Upon completion, Eclipse will need to restart. Now you are ready to get started.
A quick tutorial to start using PandionJ
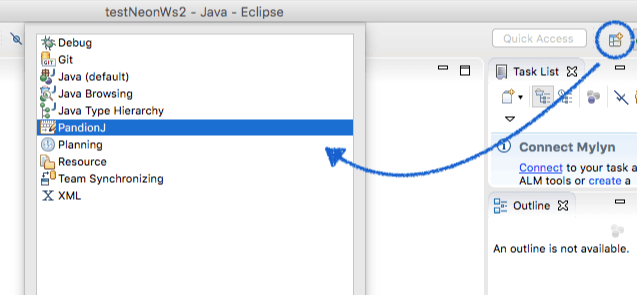
PandionJ consists of an additional view for the Eclipse Java debugger. You can only see PandionJ in action when the debugger is running. As a first step we recommend to activate the PandionJ perspective. Click on the Perspective selection action on the top-right corner of the Eclipse window.
1. Create a Java project and a testing example that has a static function. For instance, the following is a function to sum all the elements of an integer array:
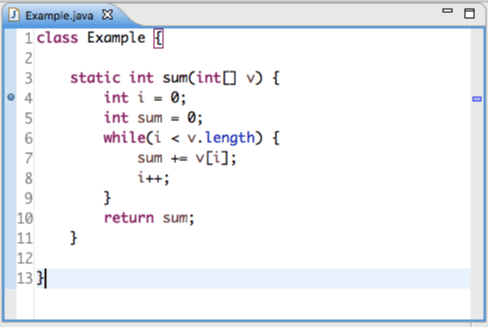
2. Set a breakpoint at a line of the funtion (first line for example). This can be done by double-clicking the left-side vertical bar of the code editor at the desired line (or by using the context menu). A blue dot will appear at the line
where the breakpoint was set. A breakpoint may be removed by double-clicking the blue dot.
3. Place the text cursor inside the function and hit CTRL-R to execute a function call in debug mode. This can only be done for static methods. If there is a main() method defined in the class, that will be executed. Otherwise, PandionJ
will instrument the class to inject a main() method that performs a call to the selected method.
If the function has parameters, a dialog will pop-up for the user to insert values.
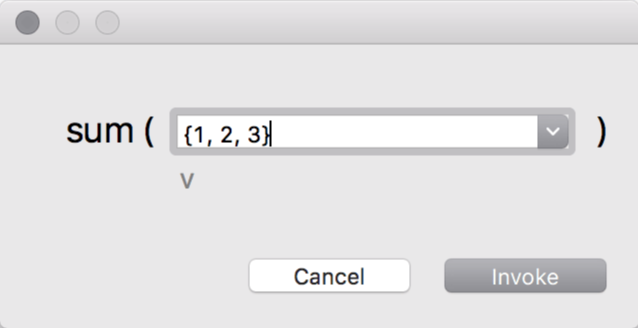
For the above example, a dialog like the following will be presented to the user.
If the parameterrs were of a primitive type, the user has to type values into the boxes (characters should be written with ' ').
In case of reference types, the user may type a reachable reference name or null.
In the special case of arrays that we see here, the user may type array values in the form {..., ..., ...}, as shown in the above picture.
When the breakpoint is hit, the execution will suspent and the PanionJ view will display the current state of the call stack.

The user may progress with the step-by-step program execution by performing step in (F5), step over (F6), step return (F7), resume, or terminate -- notice the action bar on the top-right corner of the PandionJ view.